What Causes Hyperinflation? A Deep Dive Into How Money Dies
Our Complete guide to why governments cannot just print more money explains the basic intuition: new money does not create new wealth, so printing it to pay bills shows up as rising prices. This Deep dive answers the harder question underneath it: why does that process sometimes stay a manageable inflation — and sometimes explode into hyperinflation, where prices double in days or even hours and money itself stops working? The answer is not simply “more printing”. It is a mechanism with a fiscal root, an expectations accelerator, and a point of no return that economists have measured across more than sixty episodes, from revolutionary France in 1795 to Venezuela in the 2020s.
First, the line: 50% in a month
Economists draw the line with a definition from Phillip Cagan’s 1956 study, The Monetary Dynamics of Hyperinflation: a hyperinflation begins when prices rise by more than 50% in a single month, and ends when the monthly rate stays below 50% for at least a year. Steve Hanke and Nicholas Krus, who compiled the standard list of episodes — the Hanke-Krus World Hyperinflation Table — added two conditions: the 50% rate must persist for at least 30 consecutive days, and the episode must be fully documented with replicable estimates.
Fifty per cent a month sounds large. It is worse than it sounds. Compounded over a year, 50% a month is an annual rate of nearly 13,000%. At that pace, money saved in January buys about one-hundredth as much by December. And 50% is only the entry threshold. The worst episodes on record went thousands of times further, which is why the definition matters: it separates ordinary bad inflation — Argentina’s 211% in 2023, Turkey’s roughly 85% in 2022 — from a different phenomenon, in which the currency itself collapses.
The table now lists more than sixty episodes. The first entry is France in 1795, when the revolutionary government’s assignats collapsed. Every one of them shares the same underlying pattern, and that pattern is the subject of this guide.
The worst months ever measured
Ranked by peak monthly inflation rate, the Hanke-Krus table’s worst five episodes are a study in how fast the end can come:
| Country | Worst month | Peak monthly rate | Prices doubled every |
|---|---|---|---|
| Hungary | July 1946 | 41.9 quadrillion % | ~15 hours |
| Zimbabwe | November 2008 | 79.6 billion % | 24.7 hours |
| Yugoslavia | January 1994 | 313 million % | 1.4 days |
| Germany | October 1923 | 29,500 % | 3.7 days |
| Greece | October 1944 | 13,800 % | 4.3 days |
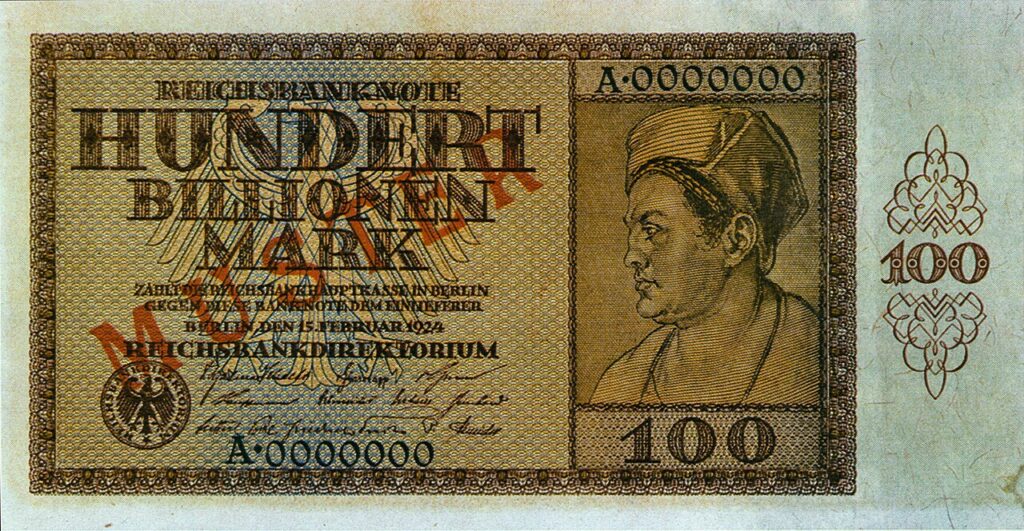
Hungary in July 1946 remains the worst inflation ever recorded: prices rose 207% a day — they roughly tripled every 24 hours — and the government issued a 100-quintillion-pengő banknote, the largest denomination ever put into circulation anywhere. Germany’s 1923 episode is the most famous but only ranks fourth. Venezuela’s first episode, from November 2016 to February 2019, peaked at 315% a month — modest by this table’s standards, ranking 14th — but lasted 27 months, the fifth-longest on record, which is its own kind of destruction.
These are not estimates from a single source. Hanke and Krus built the table from official price indices where they existed, and from black-market exchange rates and purchasing-power-parity calculations where official statistics had broken down — which, in the worst episodes, they usually had.
The mechanism: four forces that feed each other
Hyperinflation is not one cause but a spiral of four forces. Each is understandable on its own; together they explain why the process accelerates instead of settling down.
1. The fiscal root: a government that cannot pay. Every documented episode starts the same way. A government runs a deficit it cannot fund by taxing or borrowing — after a war, after production collapses, after losing access to credit — and pays its bills with newly created money instead. This is the one condition no episode lacks. It is also the reason hyperinflation never happens in a country whose government can tax and borrow normally: the printing press is the last resort, not the first choice.
2. The quantity theory, with a twist. The textbook relationship is MV = PY: the money supply (M) times how fast money changes hands (V, velocity) equals the price level (P) times real output (Y). If the money supply doubles while output and velocity stay fixed, prices double. In a hyperinflation, nothing stays fixed. Output usually falls at the same time — factories close, farms stop producing — so the same money chases fewer goods. And velocity explodes, which is the third force.
3. Expectations: people dump the currency. Cagan’s central insight was that the demand for money depends on expected inflation. When people expect prices to rise, holding cash becomes a guaranteed loss, so they hold as little of it as possible: they spend wages the day they are paid, shopkeepers raise prices in the morning and again in the afternoon, and anyone who can switches to foreign currency, gold, or barter. That flight itself pushes prices up, which confirms the expectation, which accelerates the flight. In Yugoslavia in January 1994, prices were rising 2% an hour. At that speed, the rational thing to do with money is to get rid of it immediately — and millions of people doing the rational thing is exactly what makes prices rise 2% an hour.
4. The Cantillon effect: new money is not neutral. New money does not arrive evenly. It enters through government spending, so those who receive it first — government suppliers, soldiers, state employees — spend it at old prices, while everyone else faces the higher prices it causes. Wages and savings come last. That is why hyperinflation is not just an economic event but a social one: it wipes out savers, pensioners and anyone on a fixed income first, while debtors and those with access to hard assets can profit. The middle class, which holds its wealth in money, is destroyed; the political consequences of that destruction last long after prices stabilize.
The numbers that decide it: seigniorage and the Laffer curve
Governments print money to collect seigniorage — the real revenue from creating money. If the state prints money equal to 10% of the money supply and prices have not yet adjusted, it has bought goods worth 10% of the cash in circulation. The trap, formalized by Michael Bruno and Stanley Fischer in 1990, is that this revenue has a maximum.
Cagan’s model shows why. As expected inflation rises, people hold less and less real cash — the tax base for the inflation tax shrinks. Raise the inflation rate and you collect more per unit of cash held, but there is less cash held. Past a certain point, the second effect wins: printing faster yields less real revenue, not more. The seigniorage curve is a Laffer curve. A government that keeps the presses running to fund the same deficit must print ever faster for ever less, which is why the monthly rate does not level off but accelerates: the arithmetic of the deficit demands it.
Thomas Sargent and Neil Wallace added the fiscal logic in 1981, in a paper bluntly titled “Some Unpleasant Monetarist Arithmetic”. If the fiscal authority sets the deficit and the central bank is eventually forced to monetize the debt, then tightening money today only postpones the printing — and because the debt grows with interest in the meantime, the eventual printing is larger, so inflation tomorrow is higher. The only durable fix is fiscal: the deficit itself must close. That finding is the thread that runs through every successful stabilization in this guide.
Germany 1923: the classic case
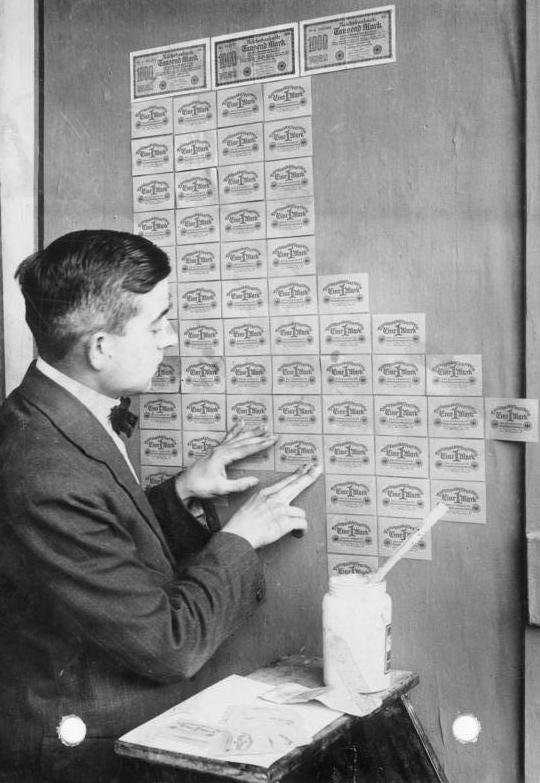
Germany is the episode everyone has heard of, and the numbers still shock. In 1914, one US dollar bought 4.2 marks. By November 1923 it bought 4,210,500,000,000 paper marks — a trillionfold collapse in nine years, most of it in the last eighteen months.
The fiscal root was war and reparations. Germany financed the First World War largely by borrowing, then lost, and owed reparations it could not pay from taxes. When France and Belgium occupied the Ruhr in January 1923 over missed payments, the German government paid striking workers and officials in the occupied region with newly printed money. The Reichsbank obliged, and the money supply exploded while output in the occupied industrial heartland stopped.
At the peak, in October 1923, monthly inflation reached 29,500% and prices doubled every 3.7 days. The 100-trillion-mark note — fourteen zeroes — entered circulation. Then, on 15 November 1923, the Rentenmark was introduced at one Rentenmark to one trillion paper marks, backed not by gold but by a mortgage on German agricultural land and industrial property. Inflation stopped within weeks. Sargent’s study of this episode stresses what stopped it: not the new currency alone, but the credible, legislated end of the fiscal regime — the Reichsbank was forbidden to discount government debt, taxes were raised, spending was cut. The price level stopped rising abruptly, not gradually, the moment the regime change was believed.
Hungary 1946: the worst ever
Hungary’s hyperinflation, from August 1945 to July 1946, is the worst ever measured, and the least famous. The country emerged from the Second World War shattered — its industry and transport destroyed, its government owing vast reparations to the Soviet Union — and paid its bills by printing pengő. By July 1946 the monthly rate reached 41.9 quadrillion per cent: prices doubled roughly every 15 hours and rose about 207% every day.
The banknote tells the story more vividly than any number. Hungary issued the 100-million-b.-pengő note — 100 quintillion pengő, a one followed by twenty zeroes — the highest denomination ever issued by any country. It was worth almost nothing the day it was printed. On 1 August 1946 the forint replaced the pengő at a rate of 400 octillion pengő — 4 × 1029 — to one forint, and the hyperinflation ended. The conversion rate is the largest currency redenomination in history, and it is the clearest single illustration of what hyperinflation does: it does not merely reduce a currency’s value, it annihilates the unit of account itself.
Yugoslavia 1994: 2% an hour
Yugoslavia’s second hyperinflation, from April 1992 to January 1994, is the textbook case of a state printing to survive. Under UN sanctions imposed in May 1992, cut off from foreign borrowing, the rump Yugoslav government funded itself — and, according to Hanke’s account, channelled large sums to allies — through the National Bank. In January 1994 the monthly rate hit 313 million per cent, prices rose 64.6% a day and doubled every 1.4 days: about 2% every hour.
It ended as suddenly as Germany’s. On 24 January 1994, central bank governor Dragoslav Avramović introduced a new dinar pegged one-to-one to the German mark, backed by foreign-exchange reserves, alongside a hard stop to deficit monetization. Prices stabilized within days. The Avramović program is still cited alongside Israel’s 1985 stabilization as the benchmark for how fast a hyperinflation can be ended once the fiscal tap is turned off — and as proof that the binding constraint is political will, not technical difficulty.
Zimbabwe 2008: the modern record
Zimbabwe holds the modern record: in mid-November 2008, monthly inflation peaked at 79.6 billion per cent, with prices doubling every 24.7 hours and a daily rate near 98%. The fiscal root was the collapse of production. The land seizures of the 2000s destroyed commercial farming — the economy’s tax base and export earner — and as revenue collapsed, the government paid its bills with the printing press. Official statistics broke down entirely; Hanke and Alex Kwok measured the inflation using black-market exchange rates and purchasing-power parity, publishing the results in the Cato Journal in 2009. Their measurement paper is the source for the 79.6-billion-per-cent figure.
The human detail is the banknote. On 16 January 2009 the Reserve Bank issued the 100-trillion-dollar note — the note our Complete guide shows — worth about US$30 on its first day, and less every day after. In April 2009 the government gave up and dollarized: the Zimbabwe dollar was abandoned and US dollars and South African rand became the working currencies. The episode ended not with a reform of the currency but with its burial. Zimbabwe has since tried twice to bring back a local currency, most recently the gold-backed ZiG in April 2024 — a reminder that the credibility lost in a hyperinflation is not restored by a new name on the note.
Venezuela: the long one
Venezuela entered the Hanke-Krus table as the 57th episode in November 2016, when its monthly inflation rate first exceeded 50% for 30 consecutive days. The fiscal root was oil: when prices fell and production collapsed, the government — which depended on oil for nearly all its export earnings and much of its revenue — covered the gap at the central bank. The first episode ran from November 2016 to February 2019, with a peak monthly rate of 315% — the 14th-worst on record — and a duration of 27 months, the fifth-longest ever documented. A second episode began in April 2020. Hanke’s account of Venezuela’s entry into the record book gives the original measurements.
Venezuela is the important counterexample to the idea that hyperinflation always ends in a dramatic stabilization. Its first episode was comparatively mild in monthly terms — 315% a month is roughly one-hundredth of Yugoslavia’s peak — but because it lasted more than two years, the cumulative destruction was immense: savings, wages and the entire price system were ground down over 27 months rather than destroyed in weeks. Duration, not just speed, is a dimension of the damage.
How hyperinflations end
The most surprising finding in the research is how fast hyperinflations end once the fiscal regime genuinely changes. Sargent’s 1982 study, The Ends of Four Big Inflations, examined Austria, Hungary, Germany and Poland after the First World War and found the same pattern in all four: inflation did not fade gradually but stopped abruptly, within weeks, when governments adopted a credible new fiscal regime. Sargent’s paper is available from the National Bureau of Economic Research. The ingredients were the same in each case: a legislated end to deficit monetization, an independent central bank forbidden to fund the government, and a credible anchor — a new currency, a fixed exchange rate, or both — often backed by foreign loans, as the League of Nations loans were for Austria and Hungary.
The later record confirms it. Bolivia’s Decree 21060 of 29 August 1985 — the first “shock therapy” program, designed with Jeffrey Sachs — devalued the peso by 93% overnight, froze public wages, cut subsidies, pegged the economy to the dollar and stopped the printing; annual inflation, over 20,000% in 1985, was about 11% by 1987, and prices had stabilized within weeks. Israel’s July 1985 stabilization combined a wage-price freeze with deep fiscal cuts and a fixed exchange rate, cutting inflation from roughly 400% a year to about 20% within twelve months. Brazil’s Real Plan of July 1994 used a transitional unit of account, the URV, to break the habit of indexing prices to past inflation before introducing the real — and inflation fell from more than 1,000% a year to roughly 20% within about eighteen months.
The pattern is consistent enough to state plainly: hyperinflation ends when the government credibly stops paying its bills with new money. Everything else — the new currency, the peg, the foreign loan — is a device for making that promise believable. And the cost of ending it is far smaller than the cost of living through it: Sargent’s central observation is that the stabilizations were fast and, relative to the preceding destruction, cheap. The expensive part is the hyperinflation itself, which destroys savings, the price system and the middle class — damage no stabilization can undo.
What the research still cannot tell you
An honest Deep dive has to say where the evidence stops. Three limits matter.
First, the line is a convention, not a law of nature. Cagan’s 50% a month is an arbitrary threshold, and the difference between 49% and 51% is not a difference in kind. Some economists argue the phenomenon is continuous — a high inflation that crosses a psychological threshold and becomes self-fulfilling — and the threshold’s exact placement does not change the mechanism.
Second, most high inflations never become hyperinflations. As the economic historian He Liping has noted, hyperinflations grow out of earlier episodes of high inflation, but most high inflations do not descend into hyperinflation — the spiral needs the fiscal root, the collapsing output and the loss of confidence together, and countries often stop one step short. That also means the model cannot predict timing: it can explain why a country is vulnerable, not the month the dam breaks.
Third, measurement in the worst episodes is indirect. When official statistics collapse, economists reconstruct inflation from exchange rates and purchasing-power parity, as Hanke and Kwok did for Zimbabwe. Those estimates are careful and replicable, but they are estimates — the exact peak month of Hungary 1946 is known to within days, not hours, and the precise daily rate depends on which price index is used. What is not in doubt is the order of magnitude, and the order of magnitude is the story.
There is also a genuine debate about sufficiency. Sargent’s fiscal view — that the deficit and its monetization are the whole story — is dominant, but others stress that production collapse is a co-cause, not just a background condition: in Zimbabwe, the destruction of farm output meant there was less to buy at any money supply, and in Venezuela the collapse of oil output played the same role. The safest statement the evidence supports is that hyperinflation needs both: a government printing to pay bills it cannot fund, and an economy producing less and less for the money to buy.
The short version
- Hyperinflation begins at 50% price rises in a month (Cagan, 1956) — about 13,000% a year — and more than sixty episodes have been documented, from France in 1795 to Venezuela in the 2020s.
- The worst ever was Hungary, July 1946: 41.9 quadrillion per cent in a month, prices doubling every 15 hours, ended by a new currency at 400 octillion old pengő to one forint.
- The mechanism is a spiral: a government that cannot tax or borrow pays its bills with new money; output falls at the same time; people expecting further rises dump cash, so velocity explodes; and new money reaches some people first, destroying savers last.
- Seigniorage has a maximum. As expected inflation rises, people hold less cash, so printing faster eventually yields less real revenue — the Laffer curve of the printing press (Bruno & Fischer, 1990).
- Sargent and Wallace’s “unpleasant monetarist arithmetic”: if the deficit is fixed, tightening money today only means more printing tomorrow. The deficit itself must close.
- Hyperinflations end fast when the fiscal regime credibly changes — Germany 1923, Yugoslavia 1994, Bolivia 1985, Israel 1985, Brazil 1994 all stabilized within weeks to months — but the savings and the middle class destroyed in the meantime are gone for good.
For the practical question — why a government that prints money to pay its debts ends up poorer, and what history shows happens when countries try — see our Complete guide: Why Can’t the Government Just Print More Money? For the ranking data behind every figure in this guide, see the Hanke-Krus World Hyperinflation Table.
Sources
- Cagan, Phillip (1956). “The Monetary Dynamics of Hyperinflation”, in Milton Friedman (ed.), Studies in the Quantity Theory of Money. University of Chicago Press. The 50%-per-month definition and the money-demand model.
- Hanke, Steve H. & Nicholas Krus (2013). “World Hyperinflation”, in Randall Parker & Robert Whaples (eds.), The Handbook of Major Events in Economic History. Routledge; updated in Hanke, Krus & Gawlik (2020), World Economics 21(2), Appendix I. The Hanke-Krus World Hyperinflation Table (Cato Institute, PDF) — the episode list, peak monthly rates and doubling times used throughout.
- Hanke, Steve H. & Alex K. F. Kwok (2009). “On the Measurement of Zimbabwe’s Hyperinflation”, Cato Journal 29(2): 353–64. cato.org — Zimbabwe’s peak of 79.6 billion per cent per month, measured by purchasing-power parity.
- Hanke, Steve H. & Charles Bushnell (2016). “Venezuela Enters the Record Book: The 57th Entry in the Hanke-Krus World Hyperinflation Table”, Johns Hopkins Institute for Applied Economics, Studies in Applied Economics. Cato Institute summary — Venezuela’s entry, 221% peak at the time of entry. The full-episode peak of 315% per month and 27-month duration are from Hanke, “Hanke’s Inflation Dashboard”, Cato Institute, October 2020.
- Sargent, Thomas J. (1982). “The Ends of Four Big Inflations”, in Robert E. Hall (ed.), Inflation: Causes and Effects. National Bureau of Economic Research / University of Chicago Press, pp. 41–98. nber.org — Austria, Hungary, Germany and Poland; inflation ended abruptly on credible fiscal regime change.
- Sargent, Thomas J. & Neil Wallace (1981). “Some Unpleasant Monetarist Arithmetic”, Federal Reserve Bank of Minneapolis Quarterly Review 5(3). Fiscal dominance: tightening money today means more inflation tomorrow unless the deficit closes.
- Bruno, Michael & Stanley Fischer (1990). “Seigniorage, Operating Rules, and the High Inflation Trap”, Quarterly Journal of Economics 105(2): 353–374. doi.org/10.2307/2937881 — the seigniorage Laffer curve.
- Popović, Danica (2022). “Yugoslav Hyperinflations and Our Saviors”, Panoeconomicus 69(2): 233–245. Yugoslavia’s January 1994 peak of 313 million per cent per month and the Avramović stabilization of 24 January 1994.
- Solimano, Andrés (1990). “Inflation and the Costs of Stabilization”, World Bank Research Observer 5(2): 167–85. The German 1923 stabilization (fiscal reform, monetary reform, Rentenmark) and Bolivia 1985.
- Morales, Juan Antonio & Jeffrey Sachs (1990). “Bolivia’s Economic Crisis”, in Jeffrey Sachs (ed.), Developing Country Debt and Economic Performance. National Bureau of Economic Research / University of Chicago Press. Decree 21060 of 29 August 1985; annual inflation over 20,000% in 1985, about 11% by 1987.